Help
Arena-Idb offers three different ways to access its content.
A searching interface allows the user to query the resource by specifying ncRNA identifiers, genomic locations or associated disease.
Alternatively, interactions between ncRNAs and their mates can be browsed by grouping results by mate type. Moreover, the whole resource content is downloadable as raw file in tab separated value (TSV) format.
* S=Sequences; CR=Cross references; Interactions (NN:ncRNA-ncRNA, NM:ncRNA-pcRNA,NG:ncRNA-Gene, NS:ncRNA-Pseudogene, ND:ncRNA-Disease, NO:ncRNA-Others)
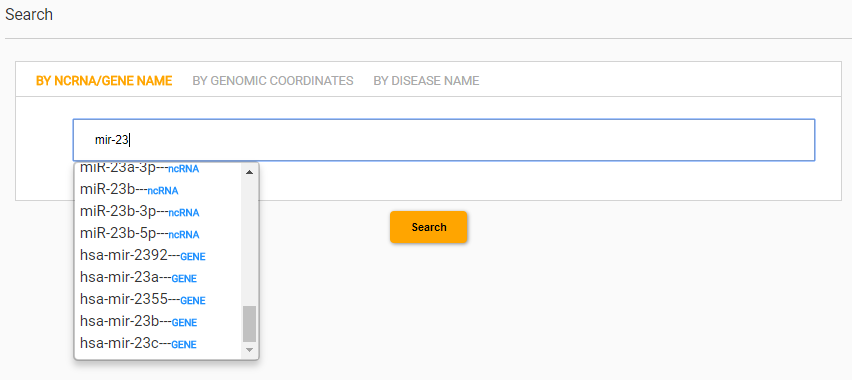
For example, while searching for mir-23, every identifier containing the searched term is show and the corresponding entity type, ncRNA or GENE, is reported aside the identifier.
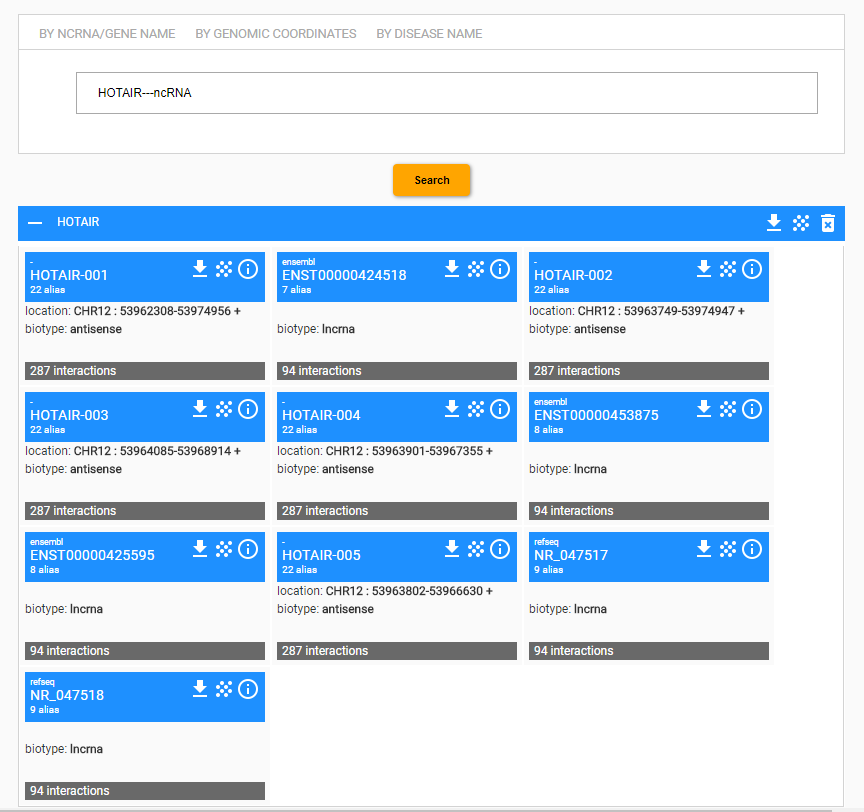
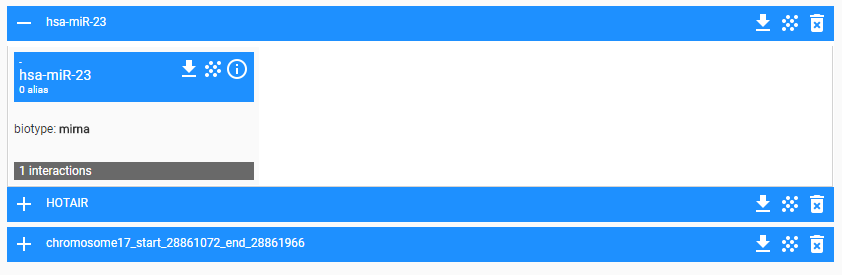
For every entity, an entity card is provided. In the following example, the HOTAIR term has been searched for. In this case, the system retrieves ten entities, and for each one entity it shows a card.
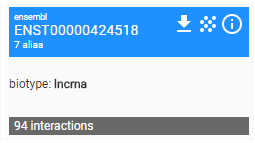
An entity card reports the primary name assigned to the entity, for example the symbol HOTAIR-001, the number of alternative aliases, genomic location and biotype of the transcript, and the total amount of interactions collected into the database. If the primary name refers to an identifier within a naming system of an external resource, such as RefSeq or Ensemble, then the name of the external supplier is reported.
On the top-right side of the entity card, three buttons allow the user: 1) to download the information regarding the entity in a text file; 2) to visualise the interaction network; 3) to open a page reporting a more detailed description of the information regarding the entity in a table text format.
The top bar of the result panel reports on the left side the term used for querying and on the right-side three buttons. The download button merges the information of every entity in the query results and creates a textual file that can be downloaded. The network visualisation button opens a page that allows the user to get a comprehensive view of the interaction network. The interaction network can be visualised by choosing the type of entities that the user wants to include. This is possible by using the checkboxes on the top bar (i.e., ncrna mates, gene mates, pcrna mates, protein mates, pseudogenes mates and phenotype mates). The “refresh graph” has to be used each time for to change the network visualisation, whereas a trash button cancels the search.
At the bottom of the info page data are provided in a table format. For each interaction, the entry reports the name of the interaction entity (Interaction Partner), the Mate Type and Biotype, the PubMed ID (if present), the resource’s name from which the interaction has been extracted (Source Database), and supporting evidence as obtained from the integrated databases or the literature. A search field placed at the bottom of each column allows the user to filter results for a specific entity.
The support information is intended to encapsulate all the information that integrated databases in ArenaIdb make available, but that cannot be integrated into a simple relational structure. Indeed, the data model that we propose is the minimal as possible because it is intended to be used as a common representation of all the integrated databases. For these reasons information uniquely reported in one or few of the sources used has been packed into the support information field.
For each source integrated into Arena-Idb, the type of information included in the Support information field are listed below:
circ2Traits: disease name, an indication of gene expression, the technology used (for example microarray), the year and title of the scientific article reporting the information.
lnc2cancer: gene expression, the technology used, tissue and cell line investigated, and a sentence extracted from the referenced scientific article that supports the relation.
lncActDB provides three different types of data: experimental miRNA targets functionally activated lncRNA-associated competing triplets (LncACTs) and cancer-associated lncActs. Regarding the first type of data, none support information is provided. The other two types of data are represented by multiple entity relations linking disease, genes, miRNAs and lncRNAs. In Areba-Idb support information field, we show the paired association and the identifiers of the other entities involved in the original relationship.
lncRNAdb: information reported in the description field of each interaction. This filed usually includes a sentence from the referenced article or a simple description of the interaction.
lncRNAdisease: manually curated information about the experimentally supported lncRNA-disease association.
mir2disease: gene expression and technology used.
miRandola: lab technology used and a sentence extracted from the referenced scientific article that supports the relation.
miRecods: expression data and a sentence extracted from the referenced scientific article that supports the relation.
miRSponge: lab technology and, if present, one or more sentences derived from the referenced scientific article that supports the relation.
miRTarBase: lab technology and type of interaction.
HMDD: a sentence derived from the referenced scientific article that supports the relation, the article title or information about gene expression.
TarBase: cell line, tissue, category, method, positive/negative, direct/indirect interaction, gene expression data and experimental conditions that are provided in the support information of TarBase database by following the given order.
Regarding the data sources not listed above, none support information is provided.
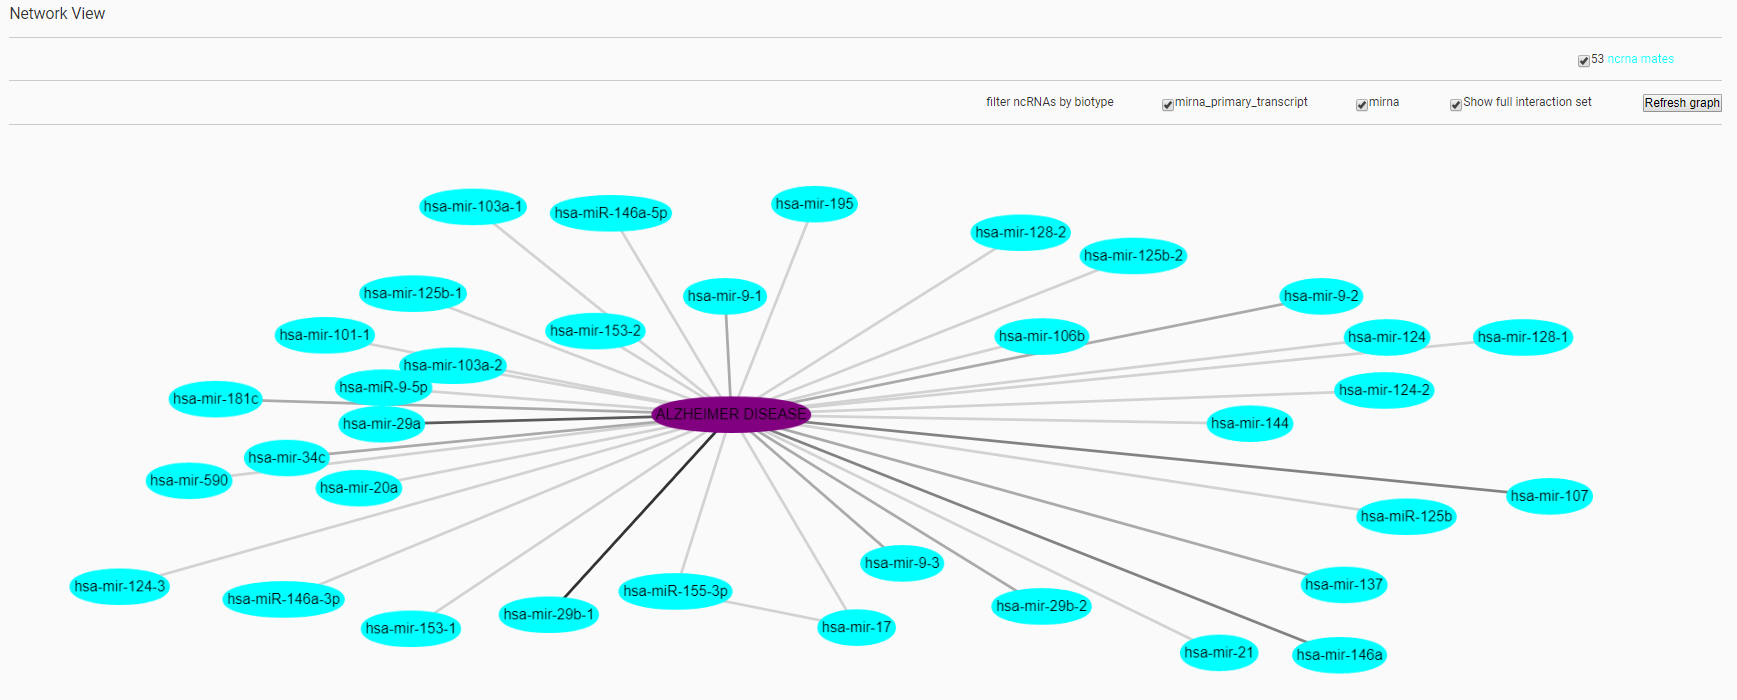
The Figure shows the results obtained by searching for Alzheimer disease.
Also in this case the result is a card that includes the list of ncRNAs that have been related to the AD, the network of interactions among the entities involved and the possibility to download the results as a txt file. The figure below shows the interaction network created by the system.
The user can select which type of mate has to be included in the visualization. Moreover, ncRNA mates can be selected by their biotype. Once the preference has been expressed, the network can be visualized via the “Refresh graph” button.
NcRNAs, genes or disease selected via the search interface as used as input elements of the visualization. The complete network is built by retrieving the interactions of the input entities. Interaction mate can be linked to multiple input elements. The user can choose to extend the set of retrieved interactions, but not the set or mates, by extracting links between the interaction mates. The choose is made by toggling the “Show full interaction set” checkbox.
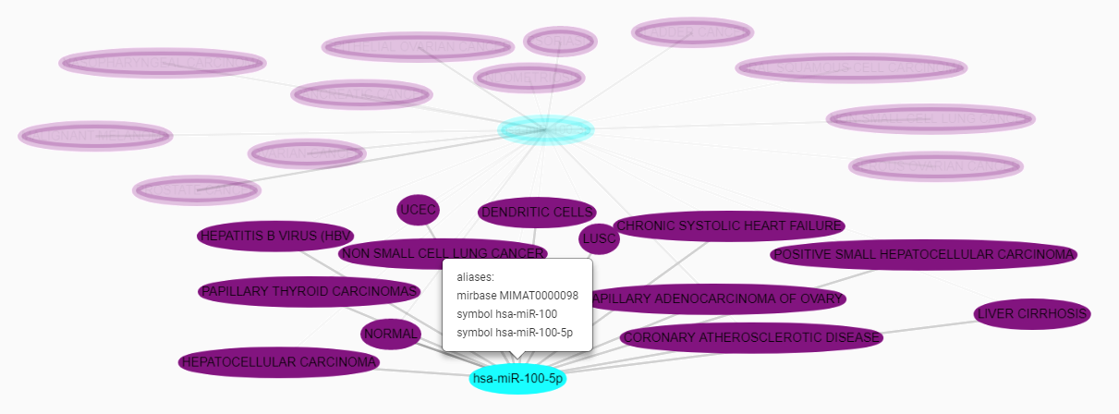
Multiple interactions between two nodes of the network are merged in one single edge. Edges are colored from grey to black depending on the amount of interactions they represent. Node are labelled by the primary name of the entity they represent. By clicking on a node, the complete set of aliases linked to the entity are displayed. Moreover, the click on a node highlight the direct neighbourhood of the entity and turns other entities opaque.
The plus button re-execute the query and shown the result of the search, while he trash button remove the search from the history.
The download return a file representing the whole network involved by the entities returned by the search. The network is given int he SIF file format such that it can be imported in Cytoscape.
For each interaction, the type and primary name of interacting entities is reported, plus the original source from which the interaction has been extracted, the PubMed of the referencing manuscript (if any), and a support sentence (if any) extracted from the manuscript or from the information provided by the input source. If the browsing is limited by a fixed number of shown interations per page, then two naviagtion buttons are available at the bottom side of the page. Moreover, the total number of interaction and the current slice of the shown ones is reported.
Integrated Resources
| Name | Version / Date of integration | Extracted interaction types* |
|---|---|---|
| HGNC | September 2017 | CR |
| GENCODE | August 2017 | S |
| VEGA/Havana | August 2017 | S |
| Ensembl | 90 | S,CR |
| miRBase | 21 | S |
| RefSeq | 84 | S |
| GtRNAdb | September 2017 | S |
| piRNAbank | September 2017 | S |
| Disease Ontology | June 2016 | CR |
| Circ2Traits | September 2017 | NN,NM,NG,ND |
| HMDD | v2.0 (September 2017) | NG,ND |
| Lnc2Cancer | August 2016 | CR,ND |
| LncActDB | March 2017 | NN,NG,ND |
| LncRNAdb | v2.0 (March 2017) | NN,NG,NP |
| LncRNADisease | September 2017 | NP,ND |
| mir2Disease | March 2017 | NN,NG,ND |
| miRandola | v2.0 (September 2017) | ND |
| miRecords | March 2017 | NG |
| miRTarBase | 6.1 (September 2017) | NG |
| mirSponge | March 2017 | NN.NM,NG,NP,ND |
| NONCODE | 4 (September 2017) | CR |
| NPInter | 3.0 (March 2017) | NN,NP |
| PSMIR | March 2017 | NO |
| StarBase | v2.0 (March 2017) | NN,NG,NS,NP |
| TarBase | v7.0 (September 2017) | NG |
Searching by name
The querying interface allows to search ncRNAs by their transcript and gene identifiers. The auto-completion function helps the user in specifying the name. A list of compatible identifiers is shown by reporting the entity type at which they refer.For example, while searching for mir-23, every identifier containing the searched term is show and the corresponding entity type, ncRNA or GENE, is reported aside the identifier.
For every entity, an entity card is provided. In the following example, the HOTAIR term has been searched for. In this case, the system retrieves ten entities, and for each one entity it shows a card.
An entity card reports the primary name assigned to the entity, for example the symbol HOTAIR-001, the number of alternative aliases, genomic location and biotype of the transcript, and the total amount of interactions collected into the database. If the primary name refers to an identifier within a naming system of an external resource, such as RefSeq or Ensemble, then the name of the external supplier is reported.
On the top-right side of the entity card, three buttons allow the user: 1) to download the information regarding the entity in a text file; 2) to visualise the interaction network; 3) to open a page reporting a more detailed description of the information regarding the entity in a table text format.
The top bar of the result panel reports on the left side the term used for querying and on the right-side three buttons. The download button merges the information of every entity in the query results and creates a textual file that can be downloaded. The network visualisation button opens a page that allows the user to get a comprehensive view of the interaction network. The interaction network can be visualised by choosing the type of entities that the user wants to include. This is possible by using the checkboxes on the top bar (i.e., ncrna mates, gene mates, pcrna mates, protein mates, pseudogenes mates and phenotype mates). The “refresh graph” has to be used each time for to change the network visualisation, whereas a trash button cancels the search.

Detailed entity description
The page reports the primary name of the entity, the list of aliases, its genomic location, the transcript sequence (if present within the primary resource used), and the type and number of interacting entities (i.e., mate ncRNA, pcRNA, gene, pseudogene, protein) and associated phenotypes.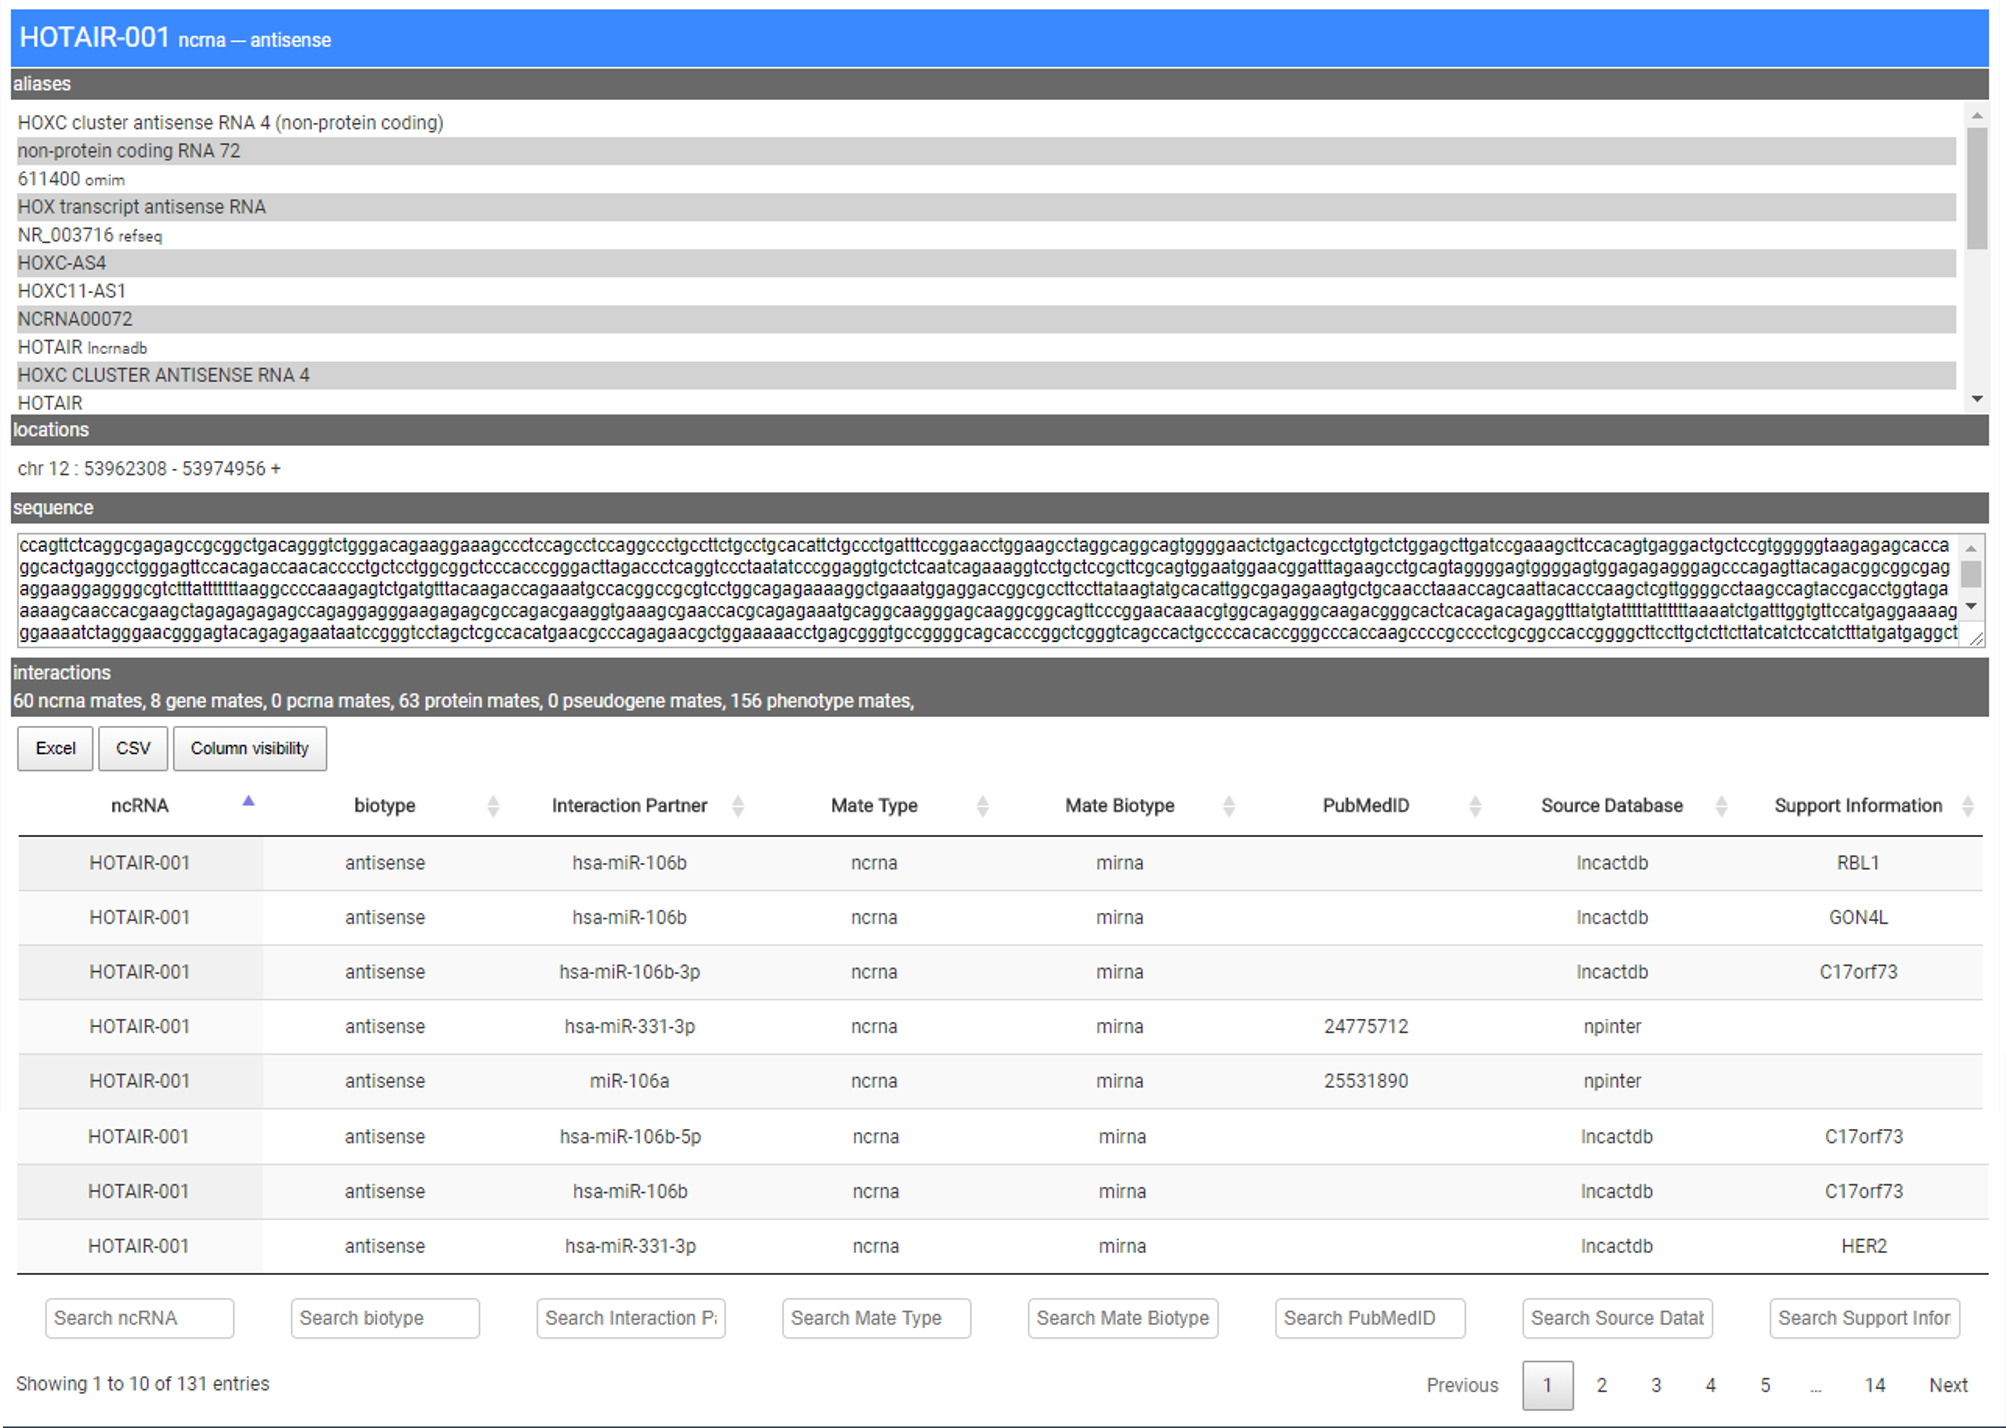
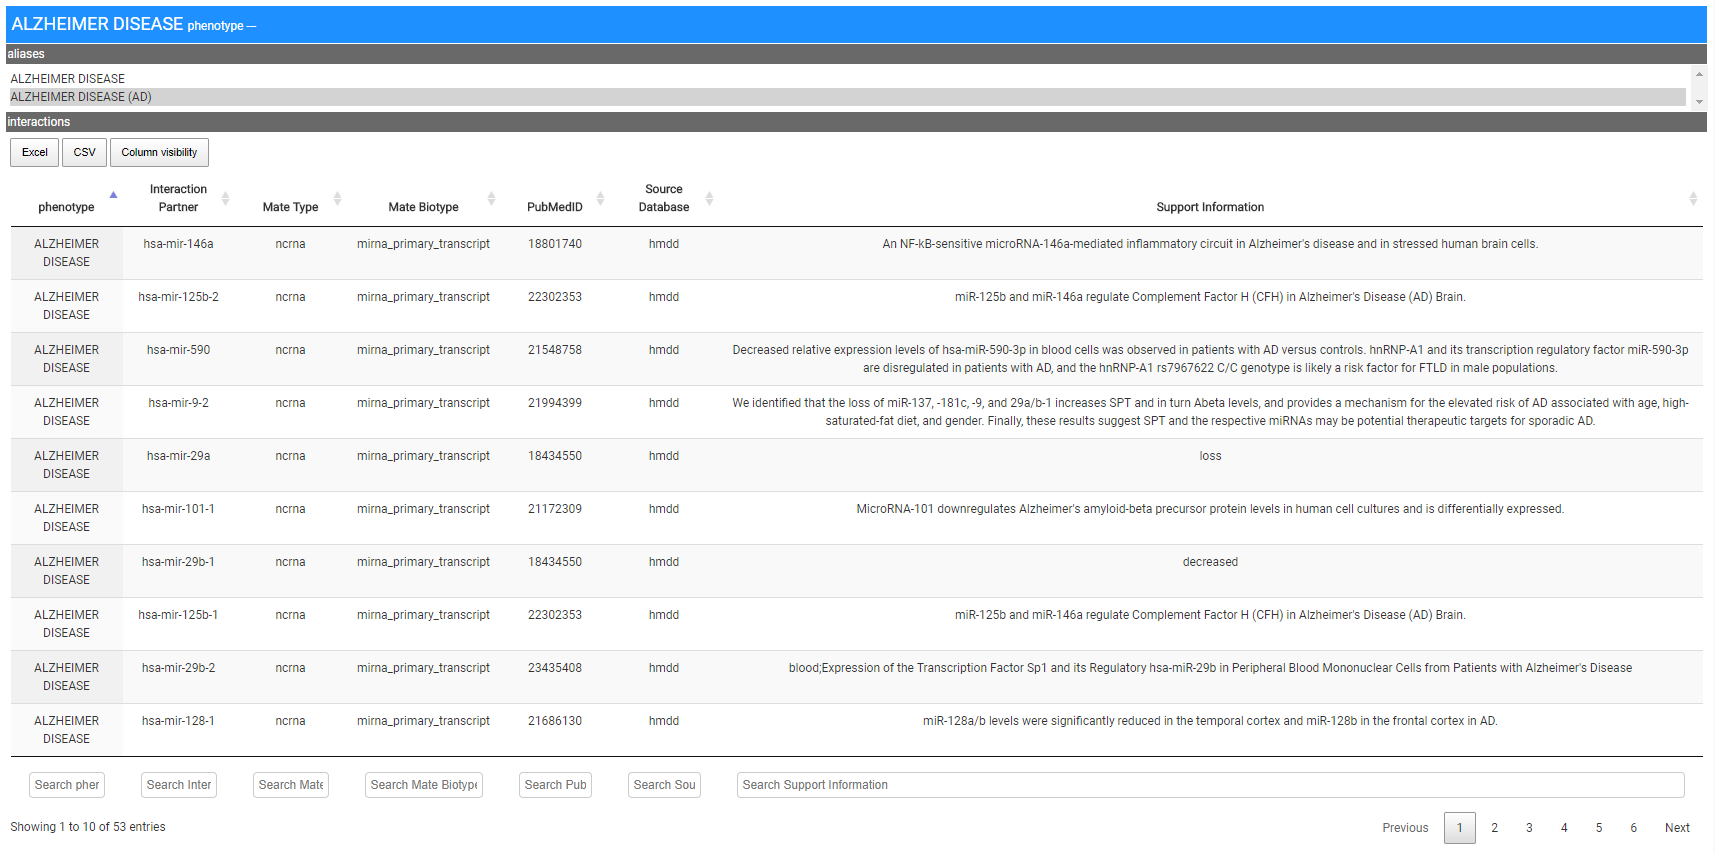
At the bottom of the info page data are provided in a table format. For each interaction, the entry reports the name of the interaction entity (Interaction Partner), the Mate Type and Biotype, the PubMed ID (if present), the resource’s name from which the interaction has been extracted (Source Database), and supporting evidence as obtained from the integrated databases or the literature. A search field placed at the bottom of each column allows the user to filter results for a specific entity.
Support Information
At the bottom of the info page, data are provided in a table format and a search field placed at the bottom of each column allows the user to filter results for a specific entity. For each interaction, the entry reports the name of the interaction entity (Interaction Partner), the Mate Type and Biotype, the PubMed ID (if present), the resource’s name from which the interaction has been extracted (Source Database), and supporting information as obtained from the integrated databases or the literature.The support information is intended to encapsulate all the information that integrated databases in ArenaIdb make available, but that cannot be integrated into a simple relational structure. Indeed, the data model that we propose is the minimal as possible because it is intended to be used as a common representation of all the integrated databases. For these reasons information uniquely reported in one or few of the sources used has been packed into the support information field.
For each source integrated into Arena-Idb, the type of information included in the Support information field are listed below:
circ2Traits: disease name, an indication of gene expression, the technology used (for example microarray), the year and title of the scientific article reporting the information.
lnc2cancer: gene expression, the technology used, tissue and cell line investigated, and a sentence extracted from the referenced scientific article that supports the relation.
lncActDB provides three different types of data: experimental miRNA targets functionally activated lncRNA-associated competing triplets (LncACTs) and cancer-associated lncActs. Regarding the first type of data, none support information is provided. The other two types of data are represented by multiple entity relations linking disease, genes, miRNAs and lncRNAs. In Areba-Idb support information field, we show the paired association and the identifiers of the other entities involved in the original relationship.
lncRNAdb: information reported in the description field of each interaction. This filed usually includes a sentence from the referenced article or a simple description of the interaction.
lncRNAdisease: manually curated information about the experimentally supported lncRNA-disease association.
mir2disease: gene expression and technology used.
miRandola: lab technology used and a sentence extracted from the referenced scientific article that supports the relation.
miRecods: expression data and a sentence extracted from the referenced scientific article that supports the relation.
miRSponge: lab technology and, if present, one or more sentences derived from the referenced scientific article that supports the relation.
miRTarBase: lab technology and type of interaction.
HMDD: a sentence derived from the referenced scientific article that supports the relation, the article title or information about gene expression.
TarBase: cell line, tissue, category, method, positive/negative, direct/indirect interaction, gene expression data and experimental conditions that are provided in the support information of TarBase database by following the given order.
Regarding the data sources not listed above, none support information is provided.
Download of entity data
To download the data reported in the entity’s entry of interest, the user has to use the download button on the top of the entity card in the search result page. In the example shown in the figures in the previous section (Hotair-001) the name of the file is Arena_Idb_HOTAIR-001.txt.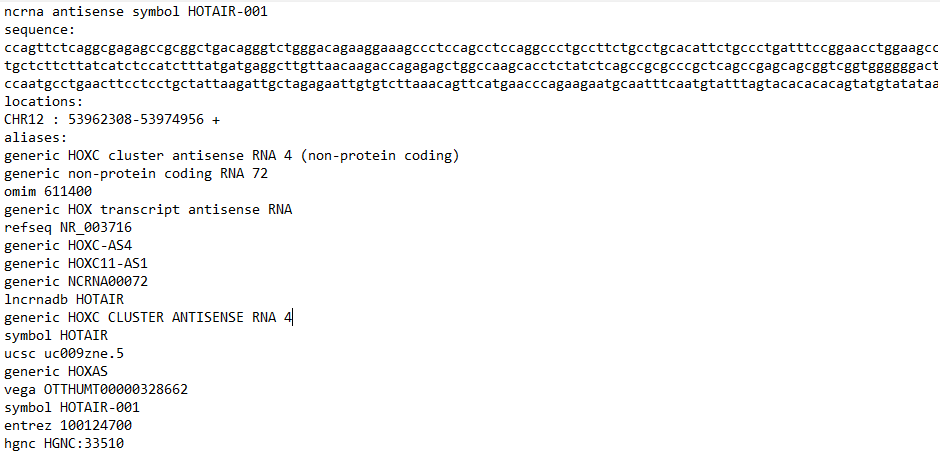
Searching by genomic coordinates
The querying interface allows the user to query for chromosome number and regions (e.g., start and end positions). Once the search is performed, the system shows the card set of ncRNAs located within the selected region.s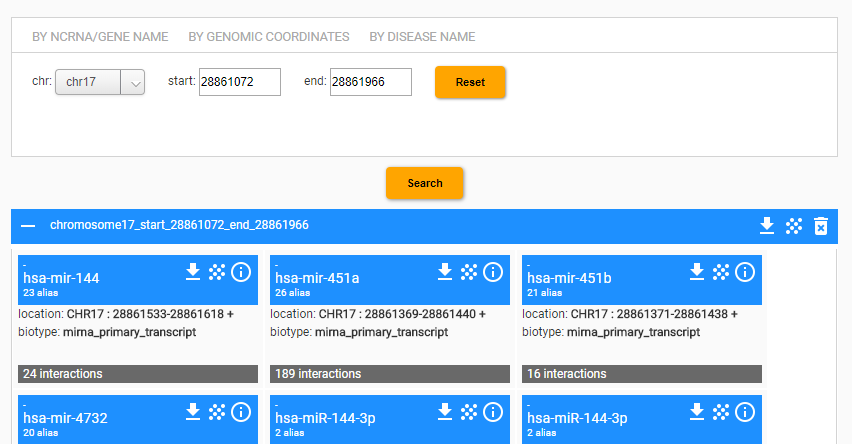
Searching by disease name
Another search option is by “disease name”. In this case, the information provided by Arena-Idb is about all mates that are related to the disease of interest and their interactions with other entities stored into the database.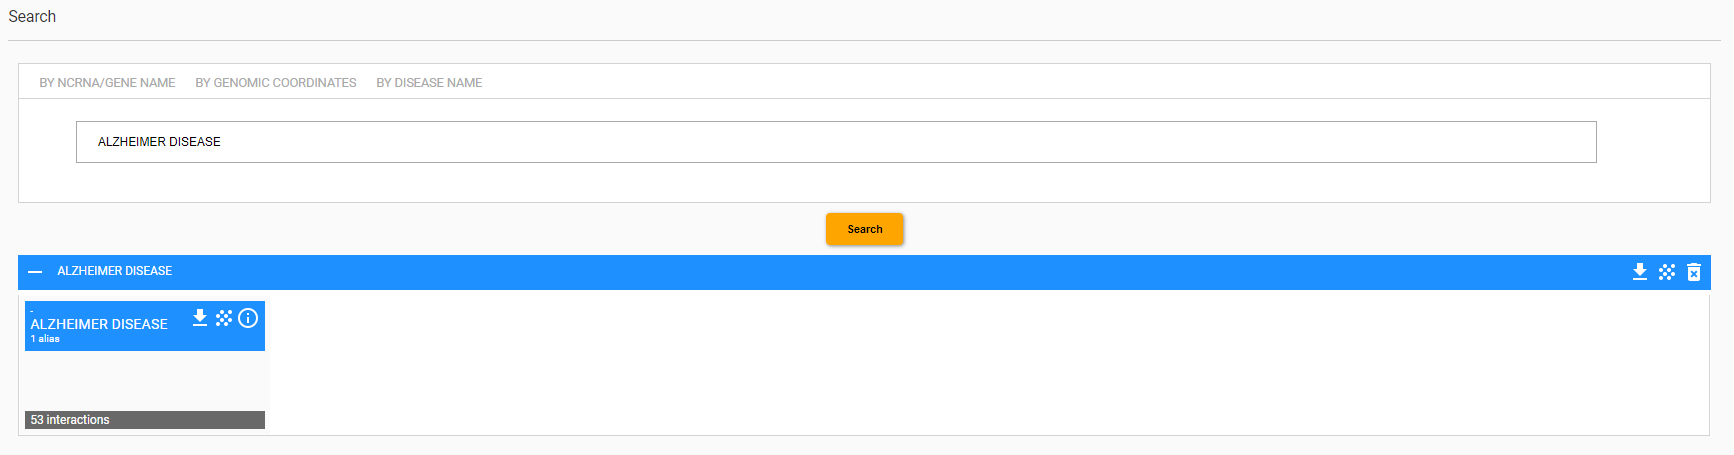
The Figure shows the results obtained by searching for Alzheimer disease.
Also in this case the result is a card that includes the list of ncRNAs that have been related to the AD, the network of interactions among the entities involved and the possibility to download the results as a txt file. The figure below shows the interaction network created by the system.
Network visualization
The network visualization mode is available through the result of the search interface. Starting from a ncRNA, a gene or a disease that have been retrieved by querying the resource, the set of interactions and corresponding interactors of the given entity can be visualized by clicking on the checkboard pattern button disposed on the top-right side of the entity card. Alternatively, the entire set of entities returned by the search, and their interactions, can be combined in a single visualization by clicking on the button disposed on the top-right side of the result panel.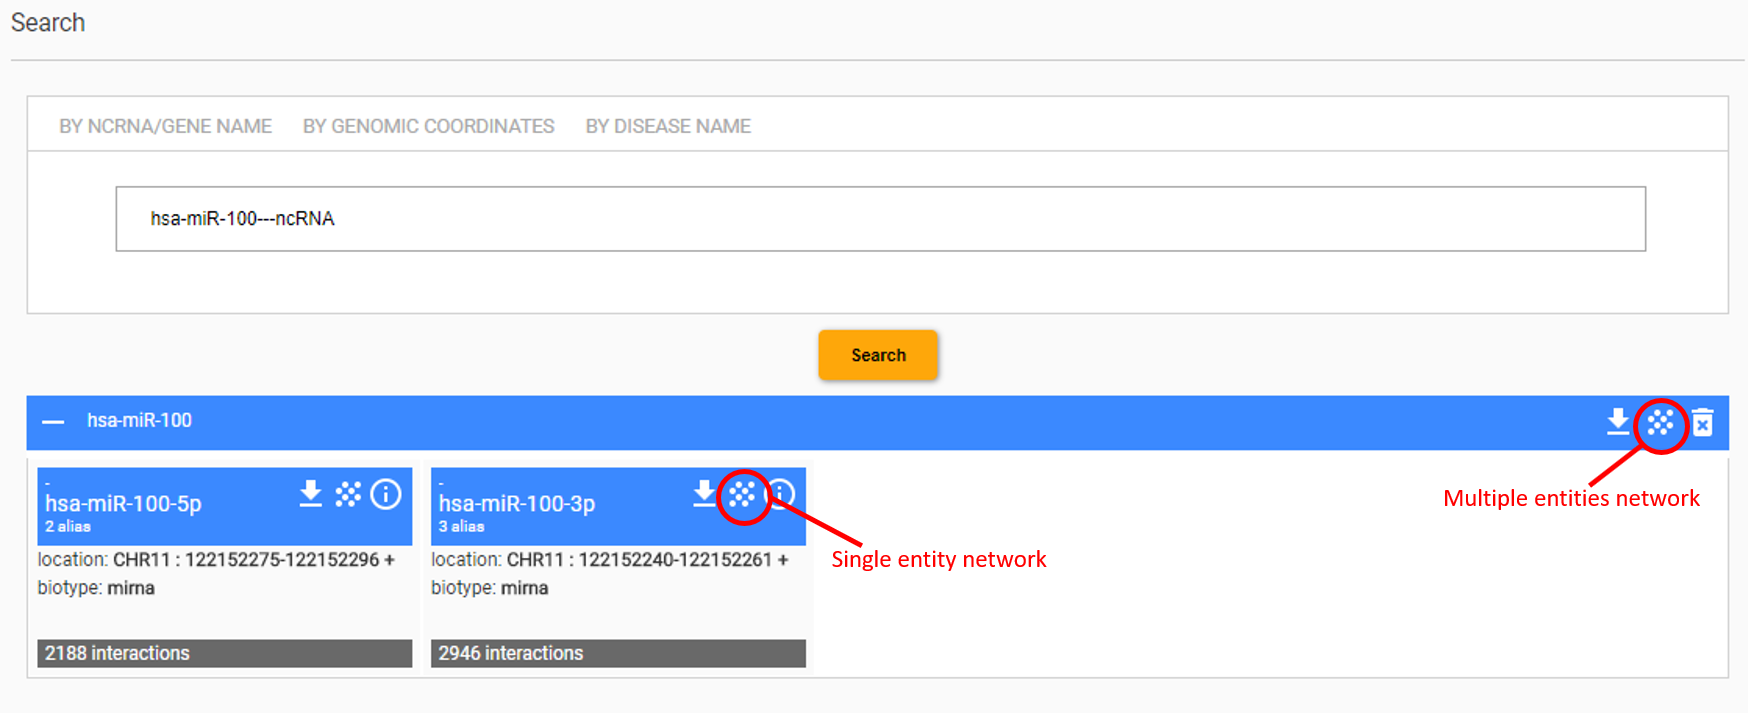
The user can select which type of mate has to be included in the visualization. Moreover, ncRNA mates can be selected by their biotype. Once the preference has been expressed, the network can be visualized via the “Refresh graph” button.
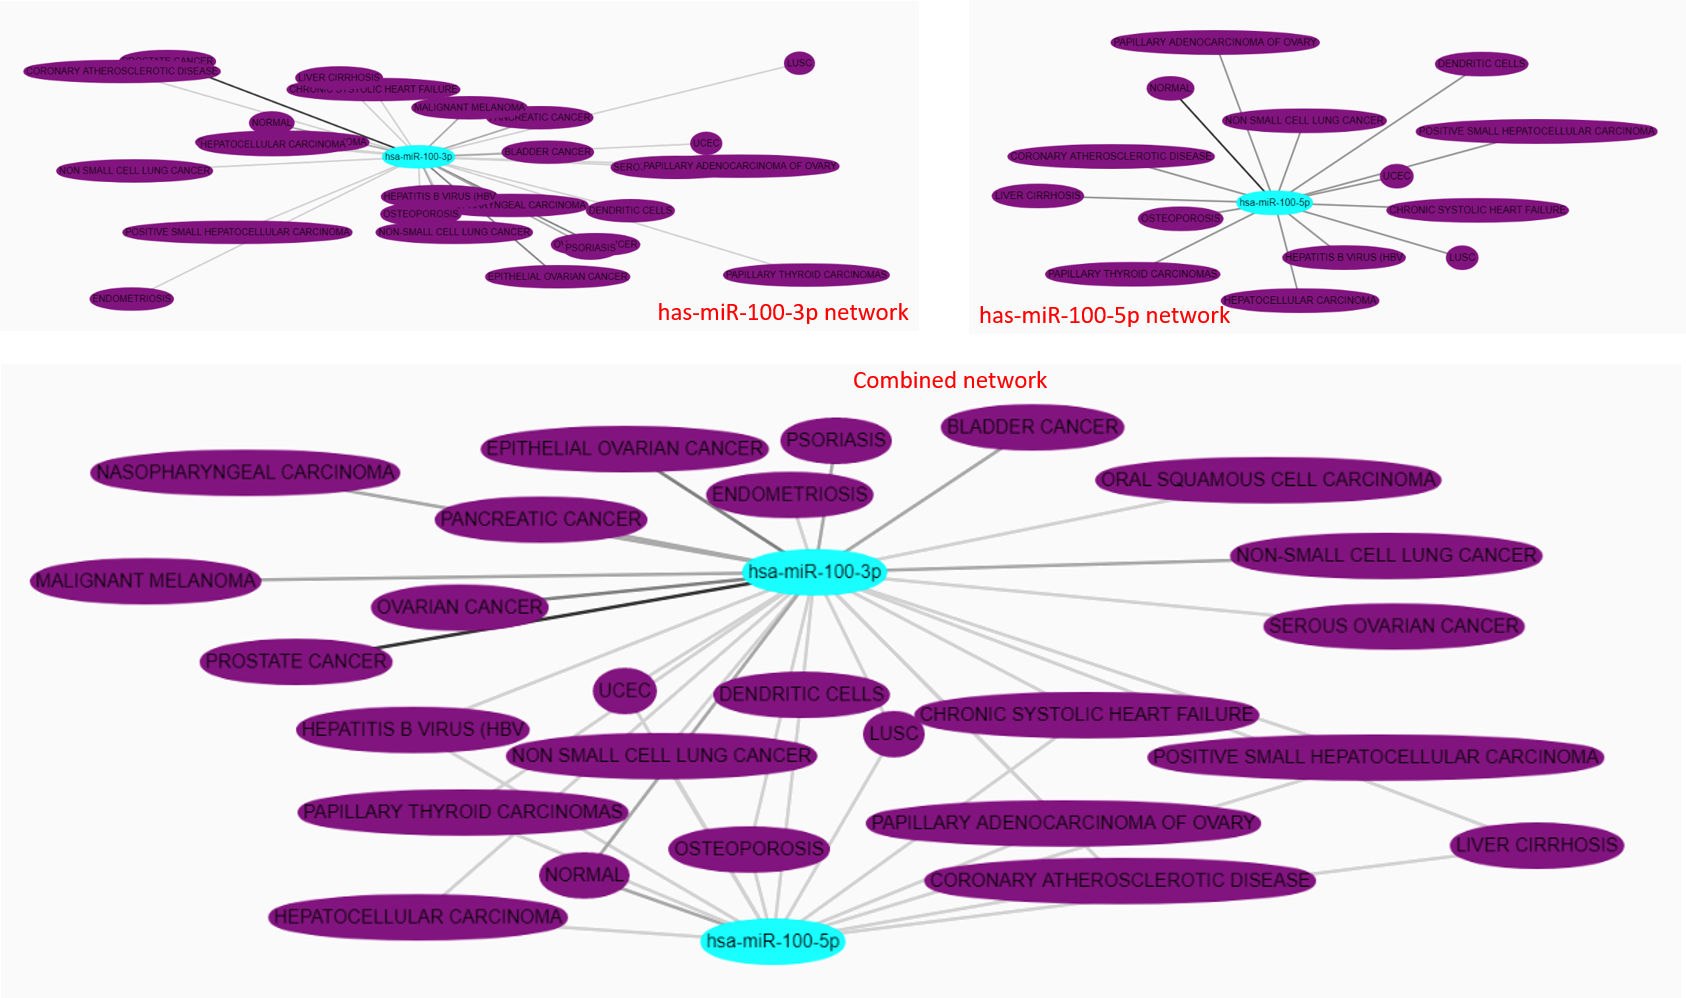
NcRNAs, genes or disease selected via the search interface as used as input elements of the visualization. The complete network is built by retrieving the interactions of the input entities. Interaction mate can be linked to multiple input elements. The user can choose to extend the set of retrieved interactions, but not the set or mates, by extracting links between the interaction mates. The choose is made by toggling the “Show full interaction set” checkbox.
Multiple interactions between two nodes of the network are merged in one single edge. Edges are colored from grey to black depending on the amount of interactions they represent. Node are labelled by the primary name of the entity they represent. By clicking on a node, the complete set of aliases linked to the entity are displayed. Moreover, the click on a node highlight the direct neighbourhood of the entity and turns other entities opaque.
Managing your searches
Arena-Idb keeps track of the searches that the user has performed in the current session. Closing the browser window or not interacting with the interface for a long time will cause the expiration of the session. The list of searches is reported in the MY SEARCHES tab.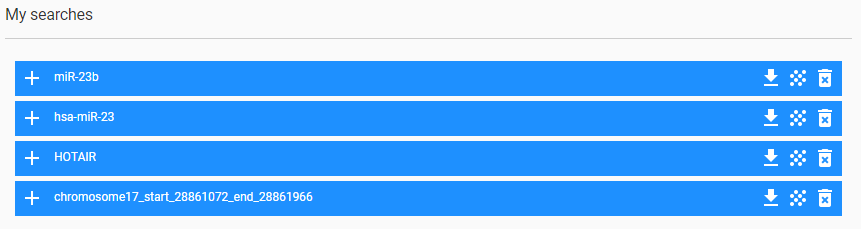
The plus button re-execute the query and shown the result of the search, while he trash button remove the search from the history.
The download return a file representing the whole network involved by the entities returned by the search. The network is given int he SIF file format such that it can be imported in Cytoscape.
Browsing the Arena-Idb content
Users can browse the content of Arena-Idb via the BROWSE interface . Interactions between ncRNA and their mates are shown. The relations are grouped by mate type (ncRNA, pcRNA, gene, pseudogene,protein and disease). The number of interactions that are shown in the current page is choosable. Moreover, the shown information can be filtered by using column-specific filters.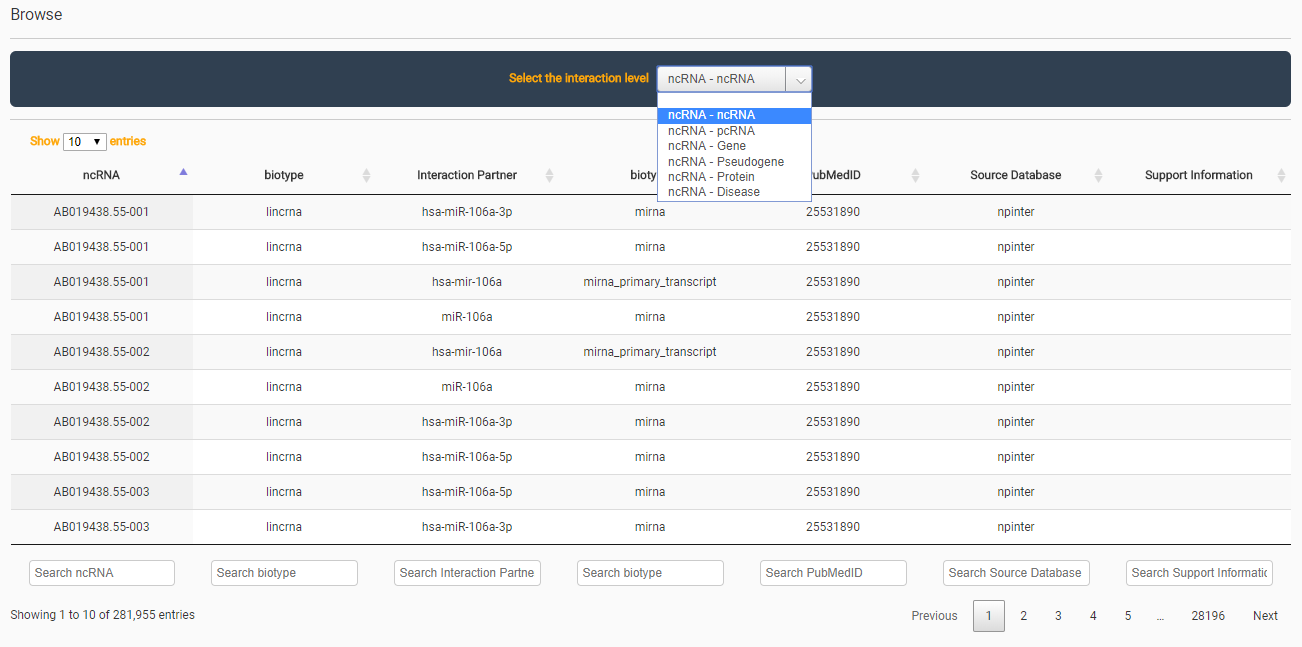
For each interaction, the type and primary name of interacting entities is reported, plus the original source from which the interaction has been extracted, the PubMed of the referencing manuscript (if any), and a support sentence (if any) extracted from the manuscript or from the information provided by the input source. If the browsing is limited by a fixed number of shown interations per page, then two naviagtion buttons are available at the bottom side of the page. Moreover, the total number of interaction and the current slice of the shown ones is reported.